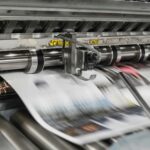
Darryl Fears from the Washington Post reports on a new study which shows that air pollution is worse in areas that were redlined in the past. This shows how environmental racism happens in our country, and how policies that were outlawed decades ago still affect health and perpetuate injustice today.
The study found that nitrogen dioxide (NO2) and fine particle (PM2.5) air pollution are higher in areas that were formerly red-lined. Fears reports that NO2 levels are higher in 80% of communities given “D” grades (“red” on the maps) and lower in 84% of communities given “A” grades (“green” on the maps).
The researchers found that annual NO2 levels in “D” or “red” areas average 16.8ppb, while NO2 levels in the former “A” or “green” areas average 10.8ppb, a difference of 6ppb. There was almost no overlap of the NO2 exposure levels of the “A/green” areas and the “D/red” areas. For annual PM2.5, average levels were 10.7μg/m3 in former “D” or “red” areas, and 10.3μg/m3 in former “A” or “green” areas. Within the former “A” or “green” areas, Blacks and Hispanics have the highest exposure to both NO2 and PM2.5, and within the former “D” or “red” areas, Hispanics and Asians have the highest exposure to NO2 and Blacks and Hispanics had the highest exposure to PM25. But the difference between “A/green” areas compared to “D/red” areas is much bigger than the difference within the red-lining group.
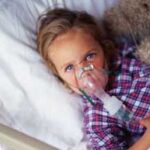
Remember that PM2.5 is associated with many health problems, from premature birth to stunted lung growth in children, to lung and heart disease, stroke, and dementia in adults. NO2 is associated with asthma, asthma attacks, and stunted lung growth in children, and lung and heart disease in adults. NO2 also increases ozone formation so areas with higher NO2 will also have higher ozone, and ozone causes lung damage and asthma and COPD attacks, as well as other health problems.
Also remember that all of the underlying conditions caused by PM2.5 and NO2 are associated with increased risk of infection with COVID, and increased risk of dying for people who are infected with COVID.
The study was conducted by the Universities of California (Berkeley) and Washington. They looked at both neighborhoods that were included in the red-lining maps used to designate “red” or “green” areas, and at all areas now classified as urban by the Census Bureau in cities that had red-lining maps. Due to the growth of cities in the last 60+ years, there are now many neighborhoods considered urban in cities that had red-lining, but were not part of the red-lining maps from 80 years ago.
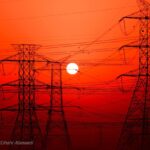
This study shows how environmental racism and the built environment affect health – more exposure for black and brown people and communities, which cause many underlying health problems and increased illness. Because of the red-lining maps, highways, power plants, and industrial facilities that were built after the 1930s were mostly built in communities of color, often with multiple highways or industrial facilities in one area. Even though red-lining was outlawed in the late 1960s, the environmental and health disparities still persist.
Cleaning up the air through clean transportation and clean power are the first but not only steps we need to take to fix the environmental injustice that our country created when we built highways and industrial facilities. Our policies decided where to build these facilities, and we need new policies to right the wrongs of the past.
Read the news report by Darryl Fears in the Washington Post here. The article has a lot of good explanations and quotes from the study authors and environmental justice advocates like Dr. Robert Bullard.
Read the scientific study here.
03/10/2022