Many cities in the Southeast have seen an improvement in air quality in the last 25 years. This is thanks to the Clean Air Act and the work of many people to monitor air quality and work for multiple solutions to clean our air.
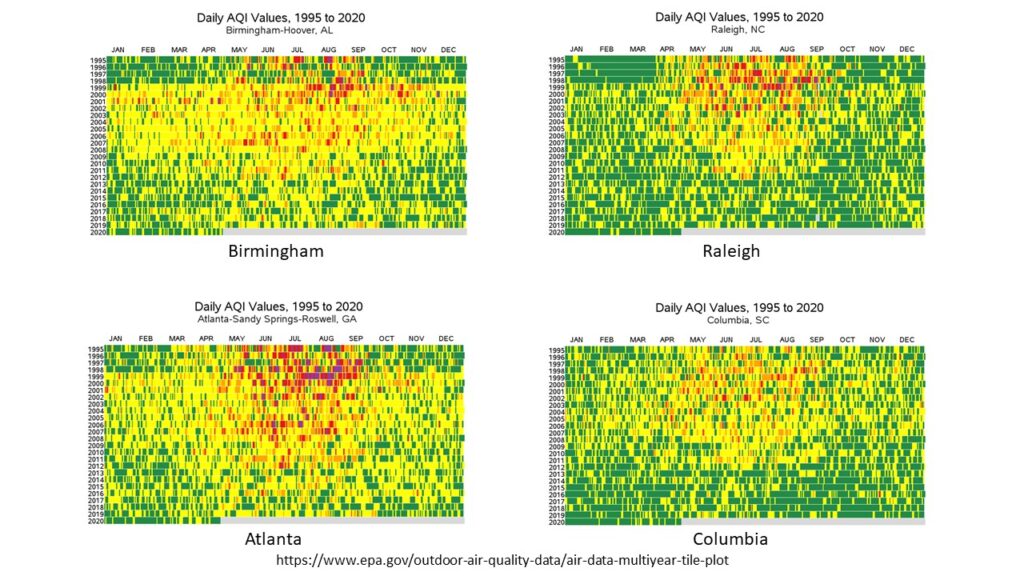
These tile plots show the daily Air Quality Index (AQI) for 4 cities in the Southeast for the last 25 years: Birmingham, Atlanta, Columbia, and Raleigh. The data is from the EPA Airdata website.
You can see that all 4 cities had a lot more purple, red, and orange days in the late 1990s, and that recently the cities are mostly green and yellow.
It shows how much we’ve accomplished, and why we need to keep our standards strong and not relax them. But in the last few years, we have lost ground with protecting our air and health, and according to the American Lung Association almost 50% of Americans living in areas that have unhealthy air.
Air pollution causes heart attacks, strokes, lung disease, and makes people of all ages more likely to get a viral lung infection. Right now, in the midst of a viral pandemic, we need to remember that clean air protects us from viruses. It is not the time to stop enforcement or weaken protections that have been in place for years. To hear more about clean air and health from health care providers, and to access resources, please visit our website: Mothers and Others for Clean Air.
You can make a tile plot for your city at the EPA website – choose multiyear tile plot, then either an individual air pollutant or all of them together (all AQI pollutants), and then which years you want to see. The max is 25 years.


